Overcharts
A fast, intuitive, professional, multiple data-feeds technical analysis software and trading platform, designed by traders for traders and educators.
Overcharts’ goal is to provide traders the best possible trading experience and chart analysis. A few of the many highlights that a subscription with Overcharts includes but is not limited to:
- One-Click trading from Chart & DOM
- Multiple Simultaneous Brokers & Data Feeds: Overcharts supports many different data feeds. You can use one or several data feeds at the same time for each instrument
- Trading and chart analysis organized in multiple workspaces and different monitors
- Professional Tick/Volume and Order-Flow indicators & tools
- Custom indicators and trading systems builder, trading strategies optimizer by performing accurate back-testings
- Educators & Community: Educators can broadcast their own workspaces to their followers saving templates on the Cloud
- All configurations saved on the Cloud. Easy to switch between different devices
Volume Profile & Tick/Volume Analysis
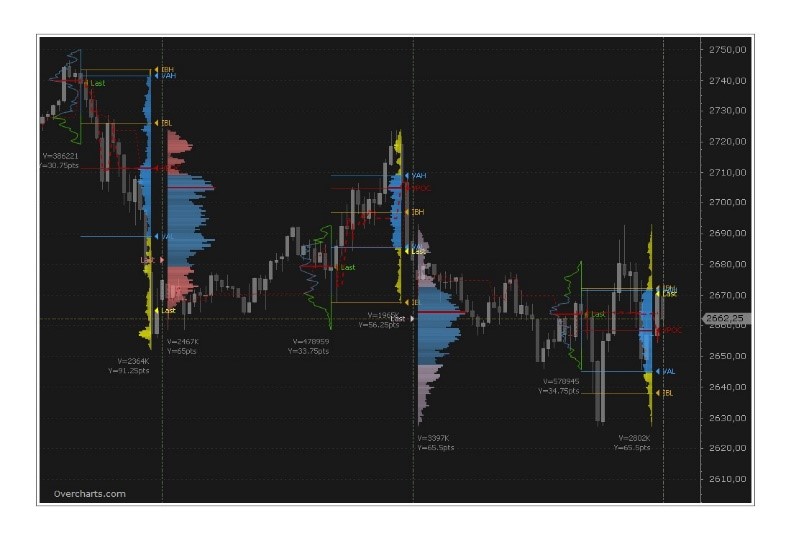
The tick/volume analysis includes a package of indicators and tools that are essential to understand market movements in advance. Volume Profile shows the volume traded in the various price levels, highlighting if there are more buyers or sellers. Available:
- Volume Profile intraday, Session, Composite, Range, Day, Weekly, Monthly
- Additional column on DOM
- Volume Delta
- VWAP
- Volume Meter
- Volume on Bid/Ask
- Session Statistics
- and more.
Volume Ladder
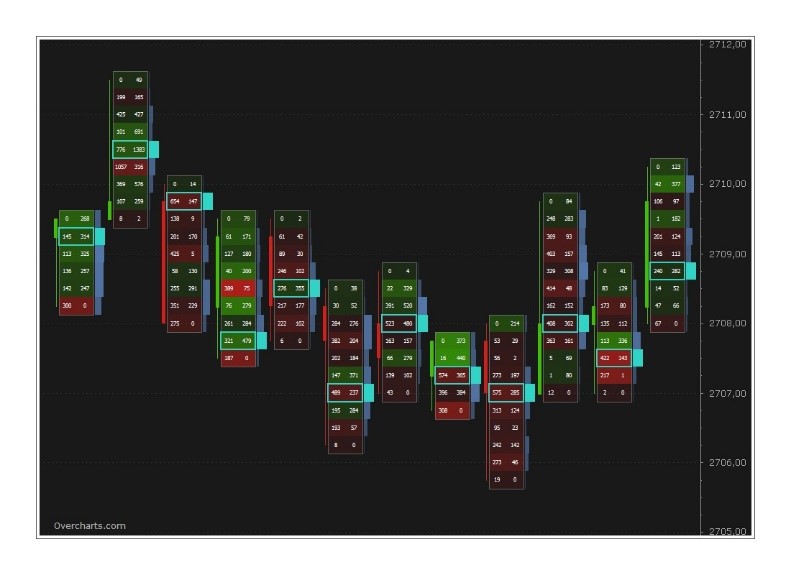
Volume Ladder is one of the most important indicators of order flow analysis. It displays Volume, Bid/Ask, Delta and other volume statistics all together inside of each bar. This allows you to trade faster and more accurately.
Market Depth Map
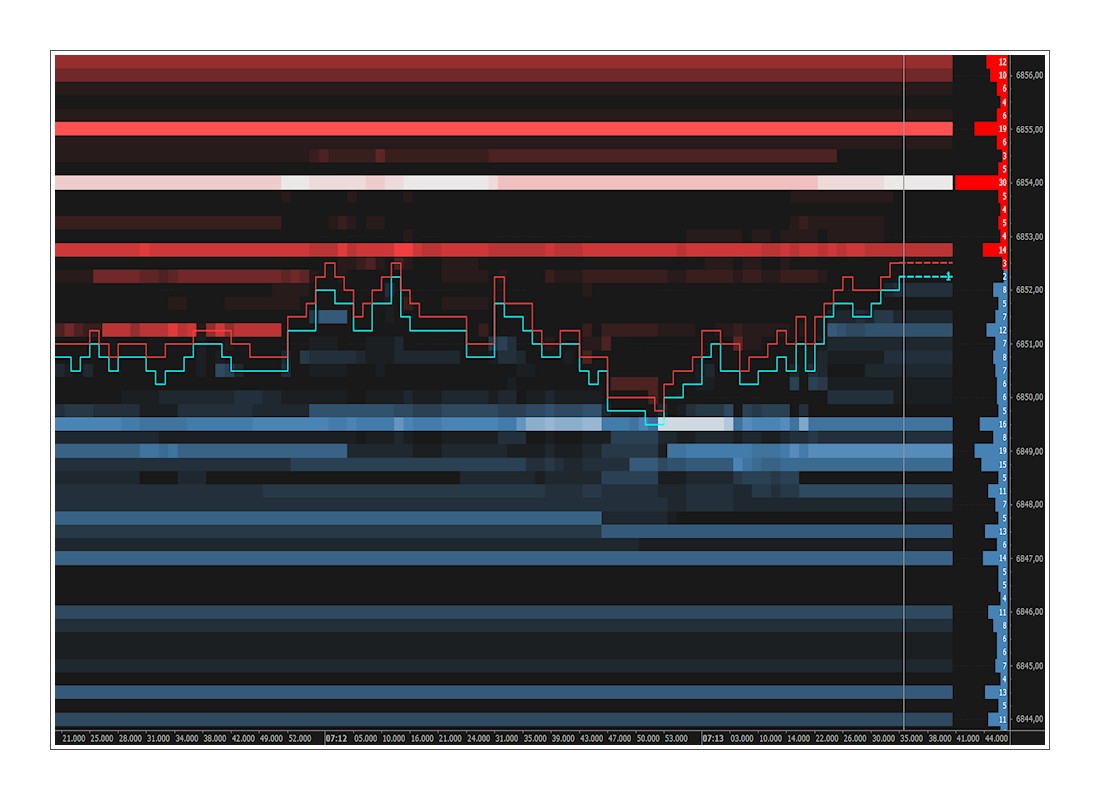
The Market Depth Map helps traders identify potential levels of support and resistance by analyzing the volumes of limit order book (DOM).
Each price level takes on a different color depending on the volume of corresponding DOM level. The higher the volume, the greater the intensity of color and, the greater the intensity of color, the higher the probability of identifying a support or resistance.
Integrated DOM & Chart Trading
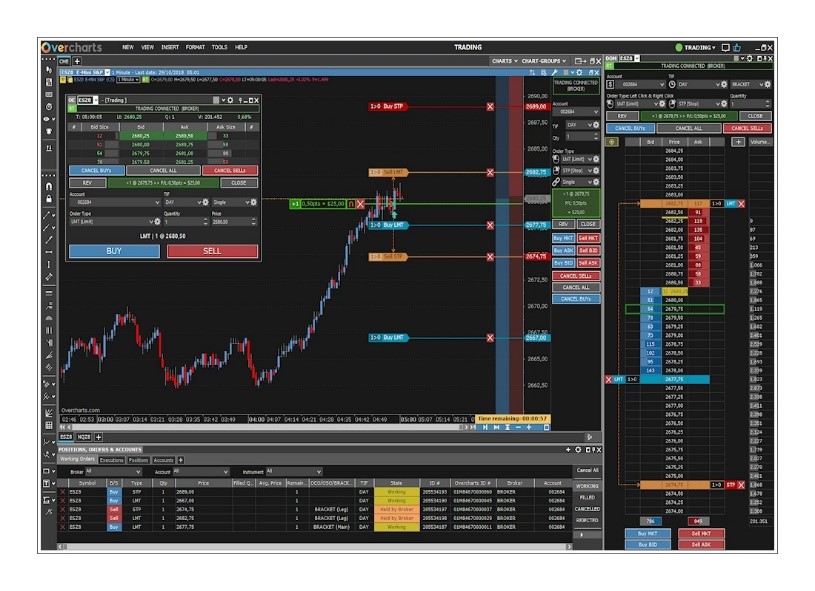
Trading from CHART or DOM? No matter! It is the same. Just one click.
Chart & DOM use the same method to place, edit or cancel orders.
Overcharts offers a wide range of order types.
Single: Market, Limit, Stop, Stop Limit, Trailing stop, Trailing stop limit, Iceberg, etc.
Linked: OCO (Order-Cancels-Order), OSO (Order-Sends-Order), BRACKET (with Target & Stop loss)
Chart Analysis
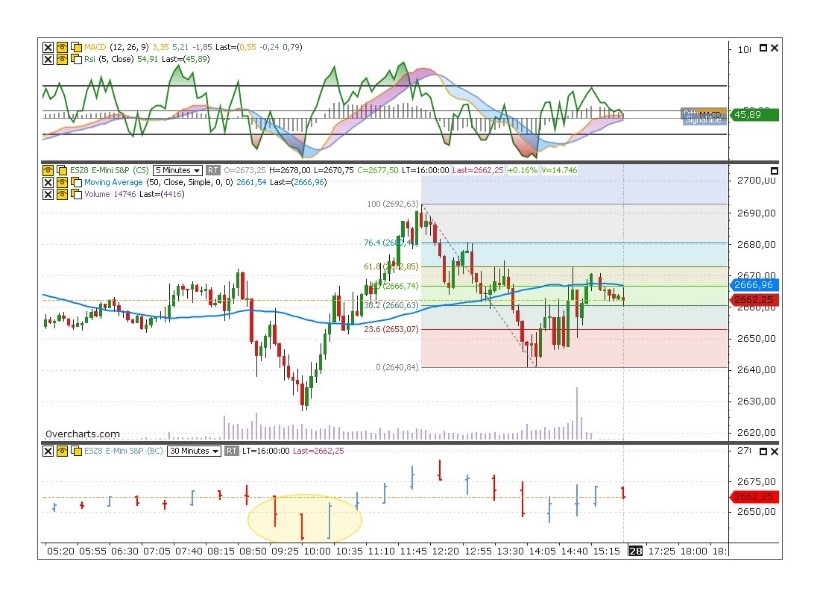
With a 4k Ultra-HD graphics engine, Overcharts allows you to make an advanced technical analysis using many types of charts. In the same window you can insert indicators and charts of the same instrument (or different instruments) with any resolution. Each chart (or data series) can display up to 100 million bars on a 64-bit operating system. Advanced Drawing tools are available: Trendline, Fibonacci, Elliott, Pitchfork, numerous Channel types, Measurement tools and many others.
Extensive trading capability, including spreads, system trading, multiple asset classes, multiple accounts, and much more.
Trading Strategies & Custom Indicators
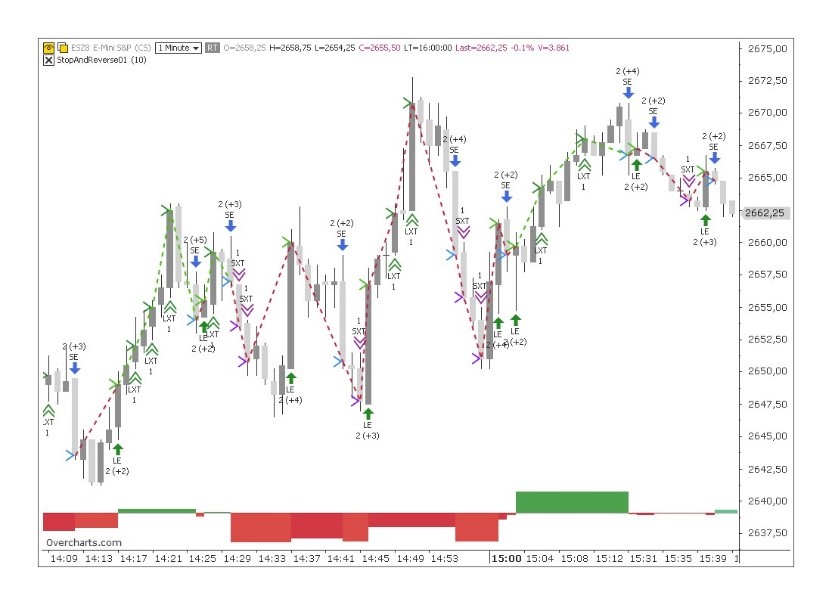
Create your trading strategies and indicators using OverBasic, a basic style easy language.
Optimize your strategies by performing accurate backtestings and consulting the results in detailed reports.


