S5 Trade Analyzer Instructions
Does the S5 TA Cloud application need to run on the same computer as my trading platform?
No. The S5 TA Cloud application pulls trade data in from the server and so can be accessed from any browser.
Can I use any browser?
Yes, but we do recommend using the Google Chrome browser for best results.
How do I get support?
If you’re really struggling and have already gone through the manual/video on this page, please send an email to ta@s5trading.com
How do I report a bug?
To report a bug, please send a message using the built in Bug Reporter. To access this, click on the following icon at the top right of the application window:

What about feature requests?
Once we get past the initial stages of making sure that the application runs as smoothly as possible, we’ll be happy to look at any feature requests.
If you have a feature request, please send an email to ta@s5trading.com
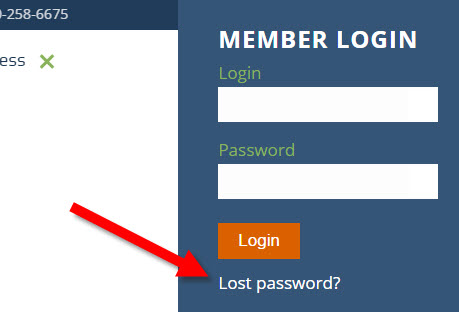
I've lost my login/password. What should I do?
Click on the hamburger menu at the far right of the main navigation menu bar. In the side bar, click “lost password”. Fill in your username or registered email address and an email will be sent to you with your username and a password reset link.
I don't see all of my accounts in the application. What should I do?
First of all, make sure that you have checked the Accounts dropdown menu:

If you still can’t see your account, it may be that it needs to be linked to your login. If you think that this may be the case, please send an email to ta@s5trading.com
Why is the RTA not updating?
If you’re certain that you’re in a position, there are a number of possibilities. First of all you need to make sure that you have selected the correct account. If you have, check the S5 TA’s connection status at the top right of the application window:
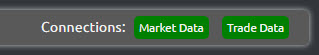
Market Data and Trade Data should both be displayed in green. If not, make sure that your internet connection is working and that your other applications connected to the same data source (e.g. Gain, CQG, etc.) have an active connection. If you can’t see an issue here, try a ctrl + shft + r. If this doesn’t resolve the problem, please send an email to ta@s5trading.com outlining the problem.
General Information
Welcome to the S5 Trade Analyzer 2016 Beta Program!
First of all, we’d like to thank you all for your participation. Your contribution is a valuable part of the development process and it is very much appreciated.
The following document covers some of the basics of the S5 Historical Trade Analyzer (S5 HTA) and the S5 Real-time Trade Analyzer (S5 RTA). Although it’s intended to cover all that you will need in order to navigate and use these apps, it is a working document and will be added to over the course of the beta.
It’s also really important to note the current focus of this beta – to iron out any bugs and usage issues and to get everything working smoothly as possible. This means that we would like you to use the apps as much as possible, looking for and reporting back on things such as usability, accuracy of data and stats, reliability, speed, etc. It also means that you should continue to use your existing tools in your day-to-day trading activities.
This is for two reasons: –
- We cannot be 100% certain that everything works yet. We’re confident, but would also not wish you to make trading decisions based on the new HTA/RTA yet.
- We need you to look for any discrepancies in the stats and, if there are any present, these will be far more obvious with something to compare your data to.
What we are not looking to do at this stage is to add more features. We really would like to hear your suggestions on possible new features for the future and there will be a place in Teamwork to take note of these. However, we hope you also appreciate the time and effort that it has taken from us to get to this point and the imperative to launch a final product as soon as possible.
Beta Instructions
These instructions are intended to guide you through the process of logging in, using and reporting any observed issues back to us. Again, this is a working document and if there’s anything that needs to be added, we will do so as it becomes necessary (You can add comments in the comment section of this notebook).
Logging In
***Please note that if you were a first round beta participant, the way you need to log into the site has changed. Please follow the instructions below.***
To access either the HTA or RTA, you will need to be logged into the website. To log in, there several options.
- Navigate to https://stage5trading.com/s5-members/login
- Navigate to either https://stage5trading.com/hta or https://stage5trading.com/rta
- From anywhere on the website, click on the hamburger menu at the far right of the main navigation menu:
Here, you will need to enter the username and password which should have already been provided to you. These login credentials have been linked to your S5 Trading account(s) including demo.
***Please note that CQG does not allow demo accounts to be accessed via their API in an appropriate way and so there are no CQG demo accounts enabled on the S5 Trade Analyzer.***
Web Addresses
Once you have logged in, you should be redirected to the RTA by default. However, if by any reason you should find that you have navigated away from the correct page, the URLs you will need to get back to are as follows: –
Layout & Panels
Historical Trade Analyzer (HTA)
For the HTA, before anything is populated you must select the data range analyze.
To do this, select a Start Date and End Date using the date-picker fields, select your account if it’s not selected by default. The HTA will recognize your account and populate the Contract field with every product it has data for during within the selected date range. Select the contract(s) you wish to analyze. Once you’ve done this, hit the Analyze button.

After you’ve got some data in the HTA, you should see something like this: –

Each panel displays a different element. These are: –
- User functions
- Data selection
- Risk input
- Contract Summary Toolbar
- Stats Toolbar
- Charts Toolbar
- Completed Trades
Customizing the view
It should be noted that there are several ways to customize the view.
The first is by resizing the panels. When some of these panels are resized, their content also resizes. This is done by hovering over the panel boundary, then clicking and dragging. When your mouse is in the right location to do this, it will change to a window resizing cursor and the line on the HTA itself will highlight.

The second way is to zoom on a chart. You can do this by clicking and dragging (1) the area of interest. To go back, click RESET ZOOM (2) on the far right.

The third way is to change the font size. You can do this by clicking on the settings cog (1) at the top right of the app and then selecting the font size (2) from small, medium or large.

Available Stats & Analyzing Data
Trade stats are delivered in several ways.
Historical Trade Analyzer (HTA)
Contract Summary Toolbar

The stats contained in the Contract Summary Toolbar are fairly self-explanatory.
These are: –
#Number of Days Traded – The total number of days, where trades for which we have data within the selected Date Range. Days where a position remains open but no trades are taken are also considered days traded.
Trades completed – The total number of completed trades, where a position has been opened and then completely flattened, irrespective of number of contracts traded.
Avg. Trades/Day – The average number of trades taken per traded session, over the selected analysis period.
Contact Count – The total number of contracts for which completed trades (not sides) have occurred.
Profit Factor – The Profit Factor is calculated as the sum of winning trades divided by the sum of losing trades.
Total PnL – The total profit/loss amount.
Win % – The percentage of winning trades across all trades.
Loss % – The percentage of losing trades across all trades. If the Loss% and Win% don’t add up to 100%, then there are scratch trades in the data-set and we don’t include those in the Loss% and Win% dial.
BSO % – Where more than 1 contract was traded, the percentage of these positions which gave the trader an opportunity to take at least partial profits before being closed for a win or loss.
Expectancy – (Average Win [ticks or points depending on your selection] x Win%) – (Average Loss [ticks or points depending on your selection] x Loss%).
Unit of Risk Input – This metric will only work when only 1 contract is selected. The idea here is to measure the returns based on the Risk Budget for the selected period and is a measure of return per unit of risk. It is disabled when multiple contracts are selected because the unit of risk measurement becomes meaningless over the period. Not currently operational but will be soon.
Captured Data for Selected Parameters – Summary of the date range and contracts selected for analysis so you can see what the data-set consists of.
Stats Toolbar
This should be viewed in two parts – the first being long/short stats and the second winners/losers stats.

Percent Long/Short – Percentage of trades taken which were long/short.
Average Long/Short Position – Average number of contracts for long/short positions.
Max Long/Short Position – Maximum number of contracts for long/short positions.
Favorable Stats = Stats for winning trades, Adverse Stats = Stats for losing trades.
Average Gain/Draw – Average units per winning and per losing trades.
Max Gain/Draw – Maximum units for winning and for losing trades.
Average TiT Gain/Draw – Average amount of time spent in a trade (Time in Trade) for winning and losing trades.
Max TiT Gain/Draw – Maximum amount of time spent in a trade (Time in Trade) for winning and losing trades.
Max MFE/MAE – The highest amount of the maximum amount any winning trade went onside (Maximum Favorable Excursion) and the highest amount of the maximum amount any losing trade went offside (Maximum Adverse Excursion) before the trade was flattened.
Average MFE/MAE – The average of the maximum amount that winning trades went onside (Maximum Favorable Excursion) and the average of the maximum amount that losing trades went offside (Maximum Adverse Excursion) before the trade was flattened.
Gross Gain/Draw – The total of all winning trades and the total of all losing trades.
Gain/Draw Available – The total of all winning trades if those trades had been closed at their peak MFE and the total of all losing trades if those trades had been closed at their peak MAE.
Trader Gain Efficiency/Draw Drag – The ratio of the Gross Gain ÷ Gain Available and the Gross Draw ÷ Draw Available.
Max Consecutive Gains/Draw – The maximum number of winning trades in a row and the maximum number of losing trades in a row.
Max BSO – The number of ticks/points where a partial profit was taken where more than 1 contract was traded and the position was closed on multiple separate orders at different times.
Average BSO – The average profit where more than 1 contract was traded and the position was closed on multiple separate orders at different times.
Max Products Traded Per Day – The maximum number of different products traded in a single session.
Most Traded Products – The product in which the most trades were executed.
Charts Toolbar
This panel has multiple charts as shown below and should be scrolled in order to see all of them.

Completed Trades
The Completed Trades panel displays a number of per trade stats. However, some are also running totals. The running total stats include: –
% Win
%Loss
Avg. Win
Avg. Loss
Expectancy
Peak Gain (Ticks)
Max Drawdown (Ticks)
Efficiency %
Avg. Duration in Win
Avg. Duration in Loss
% Full Stop
% BSO

In addition to the stats already covered in other panels, there are columns for: –
L/S – Whether the trade was Long or Short.
TSB – The amount of time spent between exiting one position and initiating a new one (Time Standing-By).
% Full Stop – The percentage of trades that hit their full initial stop.
Trade Grade (1-5) (user input) – Self-trade grading.
Trade Emotion (user input) – Self-trade emotion rating.
Trade Type (A-H) (user input) – Trade type tag to differentiate between different types of setup.
These user inputs do not require saving.
The blue “Load User Metrics” button loads previous user input values from the last three columns.
It’s also possible to export the Completed Trades table to a CSV file which you can then manipulate in Excel or another spreadsheet application, by clicking on the blue “Export Trades to CSV” button.
Real-time Trade Analyzer (RTA)
Coming soon.
Additional Functions
At the top right of the HTA and RTA there is a panel with a number of icons.

In order, these icons serve the following functions: –
Switch to RTA/HTA – This allows you to quickly switch between the HTA & RTA apps.
Bug Reporting – This button allows you to send a short message to report any bugs.
A couple of items to note in your report:
- Which section of the app you are reporting on
- What steps led up to the bug
- Any relevant details such as Live or Demo, etc.

Settings Panel – This gives access to the settings panel.

Here you are able to set the following:
- Whether the application displays results in Dollars or Ticks
- The approximate commission/fees PER SIDE that you want to include in the computations
- The font size you wish to display everything in
- The metrics you wish to include in your printouts. The more metrics you select, the more crowded the trade table will be
Print Metrics – This allows you to print your metrics to a PDF file which you can then download or print
Help – This button will lead you to a help file (not functioning until the beta is done)
Log Out – This button will log you out of both HTA and RTA sessions.
Issue Reporting & Procedures
The HTA and RTA are in beta for a reason – to ensure that they are working correctly and accurately. You should
In order to report any issue or bug, please click on the bug icon at the top right of either app
You’ll be presented with a Bug Report message window.
Here, you can type a description about the issue and the conditions that you experienced it in. E.g. If you see a statistic which you believe to be inaccurate, state the app, date range, contract, trade number and any other relevant information.
Once you hit submit, we’ll get the task straight into the Teamwork.com project you have access to. We’ll then assign it to the correct person and place it in a task list visible to you, so you can see the progress.
Again, we’d like to thank you for being part of this initial beta program and ask that if you have any questions or concerns, please email them to ta@s5trading.com.
Note: For best viewing, please select 1080p from the settings menu and click the maximize button at the bottom right corner of the video
Does the S5 TA Cloud application need to run on the same computer as my trading platform?
No. The S5 TA Cloud application pulls trade data in from the server and so can be accessed from any browser.
Can I use any browser?
Yes, but we do recommend using the Google Chrome browser for best results.
How do I get support?
If you’re really struggling and have already gone through the manual/video on this page, please send an email to ta@s5trading.com
How do I report a bug?
To report a bug, please send a message using the built in Bug Reporter. To access this, click on the following icon at the top right of the application window:
What about feature requests?
Once we get past the initial stages of making sure that the application runs as smoothly as possible, we’ll be happy to look at any feature requests.
If you have a feature request, please send an email to ta@s5trading.com
I've lost my login/password. What should I do?
Click on the hamburger menu at the far right of the main navigation menu bar. In the side bar, click “lost password”. Fill in your username or registered email address and an email will be sent to you with your username and a password reset link.
I don't see all of my accounts in the application. What should I do?
First of all, make sure that you have checked the Accounts dropdown menu:
If you still can’t see your account, it may be that it needs to be linked to your login. If you think that this may be the case, please send an email to ta@s5trading.com
Why is the RTA not updating?
If you’re certain that you’re in a position, there are a number of possibilities. First of all you need to make sure that you have selected the correct account. If you have, check the S5 TA’s connection status at the top right of the application window:
Market Data and Trade Data should both be displayed in green. If not, make sure that your internet connection is working and that your other applications connected to the same data source (e.g. Gain, CQG, etc.) have an active connection. If you can’t see an issue here, try a ctrl + shft + r. If this doesn’t resolve the problem, please send an email to ta@s5trading.com outlining the problem.
General Information
Welcome to the S5 Trade Analyzer 2016 Beta Program!
First of all, we’d like to thank you all for your participation. Your contribution is a valuable part of the development process and it is very much appreciated.
The following document covers some of the basics of the S5 Historical Trade Analyzer (S5 HTA) and the S5 Real-time Trade Analyzer (S5 RTA). Although it’s intended to cover all that you will need in order to navigate and use these apps, it is a working document and will be added to over the course of the beta.
It’s also really important to note the current focus of this beta – to iron out any bugs and usage issues and to get everything working smoothly as possible. This means that we would like you to use the apps as much as possible, looking for and reporting back on things such as usability, accuracy of data and stats, reliability, speed, etc. It also means that you should continue to use your existing tools in your day-to-day trading activities.
This is for two reasons: –
- We cannot be 100% certain that everything works yet. We’re confident, but would also not wish you to make trading decisions based on the new HTA/RTA yet.
- We need you to look for any discrepancies in the stats and, if there are any present, these will be far more obvious with something to compare your data to.
What we are not looking to do at this stage is to add more features. We really would like to hear your suggestions on possible new features for the future and there will be a place in Teamwork to take note of these. However, we hope you also appreciate the time and effort that it has taken from us to get to this point and the imperative to launch a final product as soon as possible.
Beta Instructions
These instructions are intended to guide you through the process of logging in, using and reporting any observed issues back to us. Again, this is a working document and if there’s anything that needs to be added, we will do so as it becomes necessary (You can add comments in the comment section of this notebook).
Logging In
***Please note that if you were a first round beta participant, the way you need to log into the site has changed. Please follow the instructions below.***
To access either the HTA or RTA, you will need to be logged into the website. To log in, there several options.
- Navigate to https://stage5trading.com/s5-members/login
- Navigate to either https://stage5trading.com/hta or https://stage5trading.com/rta
- From anywhere on the website, click on the hamburger menu at the far right of the main navigation menu:

Here, you will need to enter the username and password which should have already been provided to you. These login credentials have been linked to your S5 Trading account(s) including demo.
***Please note that CQG does not allow demo accounts to be accessed via their API in an appropriate way and so there are no CQG demo accounts enabled on the S5 Trade Analyzer.***
Web Addresses
Once you have logged in, you should be redirected to the RTA by default. However, if by any reason you should find that you have navigated away from the correct page, the URLs you will need to get back to are as follows: –
Layout & Panels
Historical Trade Analyzer (HTA)
For the HTA, before anything is populated you must select the data range analyze.
To do this, select a Start Date and End Date using the date-picker fields, select your account if it’s not selected by default. The HTA will recognize your account and populate the Contract field with every product it has data for during within the selected date range. Select the contract(s) you wish to analyze. Once you’ve done this, hit the Analyze button.
After you’ve got some data in the HTA, you should see something like this: –
Each panel displays a different element. These are: –
- User functions
- Data selection
- Risk input
- Contract Summary Toolbar
- Stats Toolbar
- Charts Toolbar
- Completed Trades
Customizing the view
It should be noted that there are several ways to customize the view.
The first is by resizing the panels. When some of these panels are resized, their content also resizes. This is done by hovering over the panel boundary, then clicking and dragging. When your mouse is in the right location to do this, it will change to a window resizing cursor and the line on the HTA itself will highlight.
The second way is to zoom on a chart. You can do this by clicking and dragging (1) the area of interest. To go back, click RESET ZOOM (2) on the far right.
The third way is to change the font size. You can do this by clicking on the settings cog (1) at the top right of the app and then selecting the font size (2) from small, medium or large.
Available Stats & Analyzing Data
Trade stats are delivered in several ways.
Historical Trade Analyzer (HTA)
Contract Summary Toolbar
The stats contained in the Contract Summary Toolbar are fairly self-explanatory.
These are: –
#Number of Days Traded – The total number of days, where trades for which we have data within the selected Date Range. Days where a position remains open but no trades are taken are also considered days traded.
Trades completed – The total number of completed trades, where a position has been opened and then completely flattened, irrespective of number of contracts traded.
Avg. Trades/Day – The average number of trades taken per traded session, over the selected analysis period.
Contact Count – The total number of contracts for which completed trades (not sides) have occurred.
Profit Factor – The Profit Factor is calculated as the sum of winning trades divided by the sum of losing trades.
Total PnL – The total profit/loss amount.
Win % – The percentage of winning trades across all trades.
Loss % – The percentage of losing trades across all trades. If the Loss% and Win% don’t add up to 100%, then there are scratch trades in the data-set and we don’t include those in the Loss% and Win% dial.
BSO % – Where more than 1 contract was traded, the percentage of these positions which gave the trader an opportunity to take at least partial profits before being closed for a win or loss.
Expectancy – (Average Win [ticks or points depending on your selection] x Win%) – (Average Loss [ticks or points depending on your selection] x Loss%).
Unit of Risk Input – This metric will only work when only 1 contract is selected. The idea here is to measure the returns based on the Risk Budget for the selected period and is a measure of return per unit of risk. It is disabled when multiple contracts are selected because the unit of risk measurement becomes meaningless over the period. Not currently operational but will be soon.
Captured Data for Selected Parameters – Summary of the date range and contracts selected for analysis so you can see what the data-set consists of.
Stats Toolbar
This should be viewed in two parts – the first being long/short stats and the second winners/losers stats.
Percent Long/Short – Percentage of trades taken which were long/short.
Average Long/Short Position – Average number of contracts for long/short positions.
Max Long/Short Position – Maximum number of contracts for long/short positions.
Favorable Stats = Stats for winning trades, Adverse Stats = Stats for losing trades.
Average Gain/Draw – Average units per winning and per losing trades.
Max Gain/Draw – Maximum units for winning and for losing trades.
Average TiT Gain/Draw – Average amount of time spent in a trade (Time in Trade) for winning and losing trades.
Max TiT Gain/Draw – Maximum amount of time spent in a trade (Time in Trade) for winning and losing trades.
Max MFE/MAE – The highest amount of the maximum amount any winning trade went onside (Maximum Favorable Excursion) and the highest amount of the maximum amount any losing trade went offside (Maximum Adverse Excursion) before the trade was flattened.
Average MFE/MAE – The average of the maximum amount that winning trades went onside (Maximum Favorable Excursion) and the average of the maximum amount that losing trades went offside (Maximum Adverse Excursion) before the trade was flattened.
Gross Gain/Draw – The total of all winning trades and the total of all losing trades.
Gain/Draw Available – The total of all winning trades if those trades had been closed at their peak MFE and the total of all losing trades if those trades had been closed at their peak MAE.
Trader Gain Efficiency/Draw Drag – The ratio of the Gross Gain ÷ Gain Available and the Gross Draw ÷ Draw Available.
Max Consecutive Gains/Draw – The maximum number of winning trades in a row and the maximum number of losing trades in a row.
Max BSO – The number of ticks/points where a partial profit was taken where more than 1 contract was traded and the position was closed on multiple separate orders at different times.
Average BSO – The average profit where more than 1 contract was traded and the position was closed on multiple separate orders at different times.
Max Products Traded Per Day – The maximum number of different products traded in a single session.
Most Traded Products – The product in which the most trades were executed.
Charts Toolbar
This panel has multiple charts as shown below and should be scrolled in order to see all of them.
Completed Trades
The Completed Trades panel displays a number of per trade stats. However, some are also running totals. The running total stats include: –
% Win
%Loss
Avg. Win
Avg. Loss
Expectancy
Peak Gain (Ticks)
Max Drawdown (Ticks)
Efficiency %
Avg. Duration in Win
Avg. Duration in Loss
% Full Stop
% BSO
In addition to the stats already covered in other panels, there are columns for: –
L/S – Whether the trade was Long or Short.
TSB – The amount of time spent between exiting one position and initiating a new one (Time Standing-By).
% Full Stop – The percentage of trades that hit their full initial stop.
Trade Grade (1-5) (user input) – Self-trade grading.
Trade Emotion (user input) – Self-trade emotion rating.
Trade Type (A-H) (user input) – Trade type tag to differentiate between different types of setup.
These user inputs do not require saving.
The blue “Load User Metrics” button loads previous user input values from the last three columns.
It’s also possible to export the Completed Trades table to a CSV file which you can then manipulate in Excel or another spreadsheet application, by clicking on the blue “Export Trades to CSV” button.
Real-time Trade Analyzer (RTA)
Coming soon.
Additional Functions
At the top right of the HTA and RTA there is a panel with a number of icons.
In order, these icons serve the following functions: –
Switch to RTA/HTA – This allows you to quickly switch between the HTA & RTA apps.
Bug Reporting – This button allows you to send a short message to report any bugs.
A couple of items to note in your report:
- Which section of the app you are reporting on
- What steps led up to the bug
- Any relevant details such as Live or Demo, etc.
Settings Panel – This gives access to the settings panel.
Here you are able to set the following:
- Whether the application displays results in Dollars or Ticks
- The approximate commission/fees PER SIDE that you want to include in the computations
- The font size you wish to display everything in
- The metrics you wish to include in your printouts. The more metrics you select, the more crowded the trade table will be
Print Metrics – This allows you to print your metrics to a PDF file which you can then download or print
Help – This button will lead you to a help file (not functioning until the beta is done)
Log Out – This button will log you out of both HTA and RTA sessions.
Issue Reporting & Procedures
The HTA and RTA are in beta for a reason – to ensure that they are working correctly and accurately. You should
In order to report any issue or bug, please click on the bug icon at the top right of either app
You’ll be presented with a Bug Report message window.
Here, you can type a description about the issue and the conditions that you experienced it in. E.g. If you see a statistic which you believe to be inaccurate, state the app, date range, contract, trade number and any other relevant information.
Once you hit submit, we’ll get the task straight into the Teamwork.com project you have access to. We’ll then assign it to the correct person and place it in a task list visible to you, so you can see the progress.
Again, we’d like to thank you for being part of this initial beta program and ask that if you have any questions or concerns, please email them to ta@s5trading.com.
Note: For best viewing, please select 1080p from the settings menu and click the maximize button at the bottom right corner of the video